Python 示例
Contents
Python 示例#
基本数据类型#
# Numeric Types
num_int=1
num_float=3.2
num_complex=1+2j
print(num_int,num_float,num_complex)
1 3.2 (1+2j)
# String
string_s="hello"
string_m="1+1={}".format(2)
string_f=f"1+1={1+1}"
print(string_s,string_m,string_f)
hello 1+1=2 1+1=2
# Sequence
seq_list=[1,2,3,4,5]
seq_tuple=(1,2,3,4,5)
seq_range=range(5)
print(seq_list,seq_tuple)
for a in seq_list:
    print(a)

[a+b for a,b in zip(seq_list,seq_tuple)]
[1, 2, 3, 4, 5] (1, 2, 3, 4, 5)
1
2
3
4
5
[2, 4, 6, 8, 10]
# Boolean or<and<not
t=True
f=False
c=t or f and t and (not t)
print(c)
True
# Set and Dict
set_set={1,2,"s",True}
print(set_set)

dict_dict={1:1,2:2,"three":3,string_s:"world"}
print(dict_dict)
{1, 2, 's'}
{1: 1, 2: 2, 'three': 3, 'hello': 'world'}
class MyClass():
    def __init__(self,x):
        self.x=x
    def add(self,y):
        self.x+=y
    def show_x(self):
        print(self.x)
    def __del__(self):
        print("del")

mc=MyClass(1)
mc.add(2)
mc.show_x()
3
使用Numpy操作张量#
import numpy as np
import scipy
import matplotlib.pyplot as plt
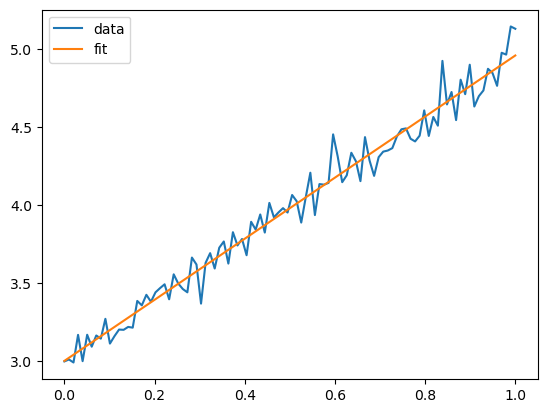
x=np.linspace(0,1,100)
a=2
b=3
noise=0.1*np.random.randn(100)
y=a*x+b+noise
使用Scipy进行线性回归#
slope, intercept, r, p, se =scipy.stats.linregress(x,y)
使用Matplotlib画图#
plt.plot(x,y,label="data")
plt.plot(x,intercept+slope*x,label="fit")
plt.legend()
plt.savefig("linear_fit.pdf")


